User Guide
Welcome to the IAR-vsc user guide!
This guide will take you through all the features the IAR-vsc plugin provides to enhance your workflow with IAR using the power of Visual Studio Code.
If you just want to get going, take a look at the Quickstart below.
Quickstart
Configure the following items:
IAR: Select WorkbenchIAR: Select CompilerIAR: Select ProjectIAR: Select Configuration
Configure an
IAR - buildtask usingTasks: Configure TaskBuild your project
Installation
IAR-vsc can be installed simply through the extension marketplace from Visual Studio Code.
Requirements
This extensions presumes that you installed the cpptools plugin by Microsoft. Also a working IAR installation is needed.
Configuring
The extension will automatically detect Embedded Workbench installations on your systems, as well as IAR projects in your VS Code workspace. You may select which workbench to use, which configuration to build, and other settings using buttons in the statusbar.

You can also call the commands behind those buttons, see the contribution tab in the extension section of VS Code.
There is also a view in the explorer tab for changing these settings. The explorer view and status bar view are functionally equivalent,
so if you want you can hide one of them by right clicking on it.
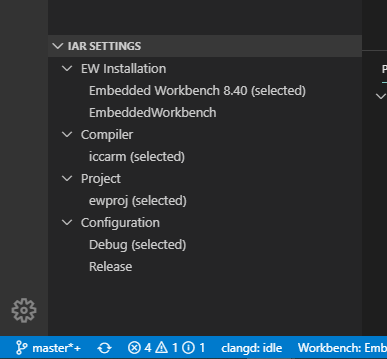
To configure your project, configure the following options:
- IAR workbench installation
- Compiler
- Project (ewp file)
- Configuration
Note that if your Embedded Workbench is installed in a non-standard location, the plugin might not autodetect it. In that case you will need to set iarvsc.iarInstallDirectories in your settings.json file, see Extension Settings.
Building
When you execute the VSCode command Tasks: Configure Task two items are added which are generated by this extension:
iar: IAR Build - template using selected workbench, project and configiar: IAR Rebuild - template using selected workbench, project and config
When selecting one of the two, a default task is generated which uses the workbench, project and configuration selected using the UI. When you select a different configuration, project or workbench, this script will use the newly selected items.
C-STAT
You can run C-STAT on your project with the iar-cstat: Run C-STAT Analysis task,
and clear the warnings with iar-cstat: Clear C-STAT Diagnostics.
When running these tasks, VS Code might prompt you about scanning the task output, and it is recommended to select Never scan the task output for iar-cstat tasks,
since these tasks do not use a regular problem matcher.
C-STAT will run the checks selected in your project settings in Embedded Workbench, but you can filter the messages in VS Code
by setting iarvsc.cstatFilterLevel in your user settings.
Debugging
In v1.1.0 settings are added to configure a gdbserver and a gdb executable. The following data for the launch.json file will use this configuration to start debugging. Currently this is only for testing and is work in progress. The settings are nog yet automatically updated when selecting different projects or confiugrations (even though the description of the settings mention this).
Open or create the launch.json file and place your cursor at the beginning of the configurations
array. Now press Ctrl + Space to activate autocompletion. You should see an item like
IAR: Debug using gdb server. If you select this, the configuration below is automatically
generated.
Some information about the used config parameters:
iarvsc.debugger: The path to the debugger to use. In case your debugger is on yourPATHenvironment you can just enter the debugger executable likearm-none-eabi-gdb.exe, otherwise, use the absolute path to the debugger.iarvsc.gdbServer: The path to the gdb server. If you are using a J-Link Segger, you will probably have to enter the full path like:C:\GNU Tools ARM Embedded\2018-q4-major\bin\arm-none-eabi-gdb.exe. Keep in mind you have to escape the backslashes\in json.iarvsc.device: The device you are want to flash and debug. Check your debug server documentation which values you can use here.iarvsc.outFile: This field is not yet used in the current release, but it is mentioned here for completeness. You can use it, but keep in mind the value you enter here can conflict in future releases.
{
    "version": "0.2.0",
    "configurations": [
        {
            "name": "Debug GDBServer",
            "type": "cppdbg",
            "request": "launch",
            "program": "Path to the out file",
            "stopAtEntry": true,
            "cwd": "${workspaceFolder}",
            "externalConsole": true,
            "MIMode": "gdb",
            "miDebuggerPath": "${config:iarvsc.debugger}",
            "debugServerPath": "${config:iarvsc.gdbServer}",
            "debugServerArgs": "-if swd -singlerun -strict -endian little -speed auto -port 3333 -device ${config:iarvsc.device} -vd -strict -halt",
            "serverStarted": "Connected\\ to\\ target",
            "serverLaunchTimeout": 5000,
            "filterStderr": false,
            "filterStdout": true,
            "setupCommands": [
                {
                    "text": "target remote localhost:3333"
                },
                {
                    "text": "monitor flash breakpoints = 1"
                },
                {
                    "text": "monitor flash download = 1"
                },
                {
                    "text": "monitor reset"
                },
                {
                    "text": "load \\\"Path to the out file\\\""
                },
                {
                    "text": "monitor reset"
                }
            ]
        }
    ]
}
Extension Settings
To change extension settings, go to Ctrl+Shift+P->Preferences: Open Settings (JSON) to open your settings.json file and add the appropriate json entries.
This extension contributes the following settings:
iarvsc.iarInstallDirectories: The rootfolder where all IAR workbenches are installed. By default this isC:\Program Files (x86)\Iar Systems. The default settings contain also the non-x86 folder in case IAR will move to 64-bit installations. For example, if your Embedded Workbench installation is atD:\Iar Systems\Embedded Workbench 8.40, add the following to yoursettings.jsonfile:
"iarvsc.iarInstallDirectories": ["D:\\Iar Systems"],
This will also let the extension find any other workbench installations in that folder (e.g. D:\Iar Systems\My Second Workbench 7.20).
iarvsc.defines: Some custom defines you can add to the define list. They follow theidentifier=valuestructure. This list will contain all intrinsic compiler functions that are known by the author of this extension. If some are missing, create a GitHub issue.iarvsc.c-StatFilterLevel: Sets the lowest severity of C-STAT warnings to display.iarvsc.c-StatDisplayLowSeverityWarningsAsHints: When the filter level is set to low, this option will display low severity warnings as ‘hints’ instead of warnings. This is helpful if you have lots of low severity warnings and want to hide them from the problems list (but still see them in the editor).
Advanced usage
Using the settings it is possible to automate other IAR tasks. You can for instance automate flashing the device or running tests in the simulator using the generated cspy scripts. These scripts are available in the settings folder present in the same folder as you .ewp file.